To perform multistation analysis you will need the WMPL libraries and RMS installed on your Desktop machine. Installing RMS and WMPL is explained in the github repos for each of the products (here and here).
Manual Reduction of An Individual Detection
Sometimes the RMS software will miss a meteor, either because its too bright or too complex to analyse. However, you can manually analyse it using tools built into RMS. Note that although you can do fireball data reduction on the Pi, it is very slow. I therefore strongly recommend you install the RMS libraries on your PC or Mac instead.
The following is condensed from Denis Vida’s excellent video tutorial here.
- Create a new folder on your PC for the analysis – lets call it c:\meteors
- Create a subfolder using the date and time of the event you want to process, eg 20230811_2232. Then within that folder create a subfolder named for the camera eg UK0006.
- You’ll end up with something like this.
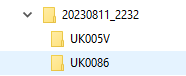
- This structure might seem odd, but its useful later on if you want to do multistation analysis. So stick with it!
- Aside: If you’re working with a zip file of raw data obtained from me, then it already contains the right structure so just make sure the “use folder names” checkbox is ticked when unzipping it with winzip.
- Copy the FF file, platepar_cmn2010.cal, mask.bmp and .config file from your Pi to the camera folder. If there’s a fireball file (FR file) copy this too.
- enable the RMS python environment.
- In the RMS directory run the following all on one line, replacing the date and camera name as needed.
python -m Utils.SkyFit2 c:\meteors\20230811_2232\UK0006 -c c:\meteors\20230811_2232\UK0006\.config- A dialog box will appear titled “Select the platepar file”. Double-click on the platepar file to select it, and the manual meteor analysis tool, SkyFit2, will now open.
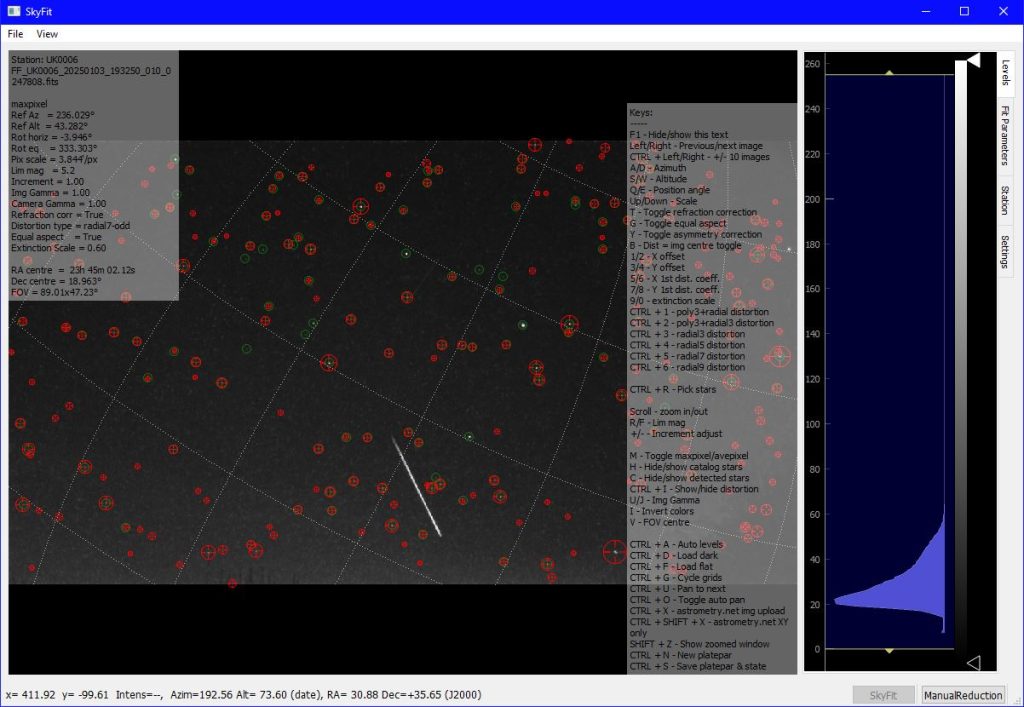
If the meteor isn’t visible, press “M” to select the maxpixel view. You can press F1 to hide and unhide the information panels.
- First, you should check the platepar.
- The initial screen shows you where the platepar thinks you are pointing. If the red markers are exactly on top of the real stars, all is fine. Otherwise you should recalibrate the platepar.
- Personally i always do this anyway – it only takes a few minutes if the original plate was pretty close.
- Use the mouse scroll wheel to zoom in and check. If the patepar is inaccurate follow this process:
- If necessary, use the keys a/d/w/s to move the map around. Other keys rotate and stretch the view. Press F1 to reveal and hide the instructions. Press left and right arrows to move between FF files.
- When pretty close, press Ctrl-R to enter star-picking mode, then zoom in on a star using the mouse scroll wheel.
- Click on a star. You should see two crosses appear, a yellow one on the real star and a blue one on the red circle that the software thinks is the corresponding star in the map.
- If the right reference star was selected, press enter.
- If the wrong star was selected, press escape and try again. Avoid double stars where the software might get confused.
- Repeat this for at least 20 stars, covering all parts of the sky.
- After you have about 20 stars matched, press Ctrl-Z to recalculate the plate. Press Alt-tab to switch back to the window you started SkyFit2 from and you should see the results of the fit. Aim for a accuracy of < 1 pixel and a few arcminutes.
- If the plate looks good. Press Ctrl-S to save it. Otherwise you can right click to deselect stars, or left-click to add more.
- Once you’ve finished doing the platepar, press Ctrl-R to exit star-picking mode.
- Exit SkyFit2 at this point.
- Now you can do manual reduction.
- There are two ways to do this, a more accurate way with the FR files, and a slightly less accurate way with the FF files.
- Using the FR files:
- The FR file contains uncompressed video and can be used to do more accurate data reduction, whereas the FF file video has been compressed.
- To use the FR files, rename any FF files to “.unused” otherwise skyfit will automatically load them.
- Now, restart SkyFit2. This time you will be prompted to select an FR file to process
- Using only the FF files:
- If you only have the FF files, don’t worry, you can still proceed though its less accurate. Just restart SkyFit2 again.
- Select the platepar you made in step 1 and then select the Manual Reduction button at the bottom right.
- We are going to identify each frame that contains the meteor and mark the location of the “centroid”. The centroid is the middle point of the visible meteor as best we can estimate it. We will also mark the area covered by the trail so we can estimate magnitude.
- You will notice that when you move the mouse around the message bar at the bottom shows the RA and Dec, Alt and Az etc. This indicates that the platepar has been loaded.
- Use the cursor keys to find the first frame which shows the meteor. Up and Down arrows move 25 frames at a time. Left and right move one frame. You can zoom in with the mouse scroll wheel.
- Press Ctrl-R to enter point picking mode. Now zoom in on the area containing the meteor.
- Left click where you think the centroid is. The software will try to guess. If the guess is clearly wrong, hold the Ctrl key and click again and the marker will move.
- Hold down shift and left-click to shade in the meteor track that’s visible in this frame. This is used to measure the meteor’s brightness. Shift-right-click will rub out and Ctrl-mousewheel will make the circle smaller or bigger.
- Go to the next frame and repeat. Do this for each frame containing the meteor.
- When done, press Control-S. This will save a new file containing the meteor position and brightness.
- You can now quit SkyFit2
Output of Manual Reduction
- Manual reduction creates the following files:
- A new FTPdetectinfo file ending in “_manual”, and a revised platepar, containing the revised RMS data and alignment data.
- A file ending in “.ecsv”. This is a common data format that can be used to share data with other networks. The ECSV file can also be used with other ECSV files in the Multistation analysis mentioned below.
- A new FTPdetectinfo file ending in “_manual”, and a revised platepar, containing the revised RMS data and alignment data.
Multistation Analysis
This is the manual process for calculating orbits and trajectories. To do this analysis you need data from at least two cameras in different geographic locations more than 50km but less than 700km apart, and which saw the same event.
We’re using WMPL – Western Meteor Python Library – which is written by the Meteor group at the University of Western Ontario (UWO) who also set up and run the Global Meteor Network. Download WMPL from github here and carefully follow the instructions to install it. It is not trivial.
To solve an orbit using WMPL:
Collect the Data
- Create a folder on your C drive to do the analysis in – for example c:\meteors
- create a subfolder using the date of the event you want to process, eg 20230811_2232.
- There are three sources of data I’m going to discuss
- If you’re working with a zip file obtained from me, then it contains the right structure so just unzip it into the analysis folder. (in Winzip remember to tick “use folder names”).
- You can also use UKMON’s detections API to obtain ECSV files of individual detections. Copy all the ECSV files into the dated subfolder then jump to Identify the Best Data below.
- And lastly, you might have obtained raw data directly from cameras. In that case, collect the data from each camera into its own subfolder as explained in the manual reduction process above but don’t reduce it just yet.
Identify the best data.
- This will generally be images where the start and especially the end of the meteor are in-shot, the meteor’s track is long, and no part of it is completely saturated.
- Pay particular attention to images with the end point of the meteor, as we want as much data as possible for this.
- Avoid images where the meteor track is very short as these head-on or very distant views offer poor spatial and velocity resolution and will negatively impact the solution.
- Also avoid images where the meteor is very bright and overblown. It’ll be really hard to identify the centroid in these and accuracy will be poor.
- You can use SkyFit2 to view the FF files if you have them, or you can look on UKMON’s live stream if you’re working with UK data.
- At first, you’ll be tempted to include as much data as possible. This is usually counterproductive, but do experiment to see why. A good choice is three or four cameras which had side-on views of the event. Remember that we’re aiming for good quality data, and that might mean excluding some images that otherwise look ok. Don’t be afraid to ignore data that makes the solution worse.
Manually Reduce Each Camera
- This is only required if you’re working with the raw data either direct from cameras or from a zip file.
- Once you’ve identified the images you want to include, go through the Manual Reduction process described above for each useful image in turn.
Finally, Solve It
- Once you’ve reduced data from at least two cameras and have ECSV files, open a command prompt, change folder to the location of WMPL, and activate its python virtual environment.
- Then run the correlation process as follows:
python -m wmpl.Formats.ECSV -l -x -r 20 -w c:\meteors\20230811_2232 - (or wherever your data is)
- By default, ECSV will try to find 100 good simulations but this may take many hours so i usually restrict it to 20 using the -r parameter eg “-r 20”. I generally find 20 is sufficient except for very low quality data. However, do experiment if you want.
- If the solution fails, revisit the data and consider the following:
- If one camera was consistently marked as ignored, try excluding it.
- To exclude a camera, rename its ecsv file from .ecsv to .bad. Don’t delete the file though, you might want to re-include it later.
- Check the “lags” and “lengths” graphs. If its one camera’s track is at an angle to the others, this means its probably an unrelated meteor so exclude it.
- If you have more than two cameras, you can try systematically excluding them one by one.
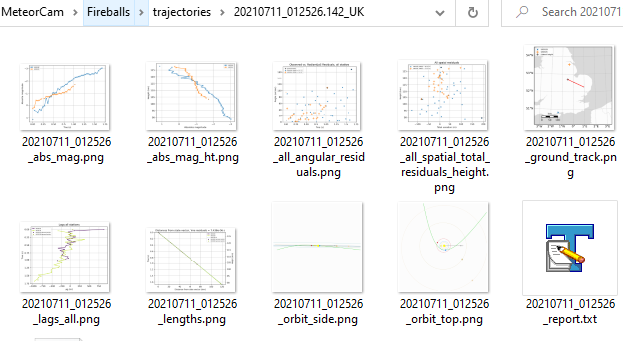
- At the end of this process a new folder will appear containing the results of the analysis. The report.txt file contains the text output that is also displayed onscreen during processing. There should also be a bunch of graphs and charts, and a “pickle” file. This contains full details of the solution in a compressed binary format.
- Ideally, the residuals graphs should all be under 200-300 metres and the state vector (lengths graph) should be a smooth curve.
- Once you have a good solution, then if you’re in UKMON you can send me the pickle file by email and i can upload it to the UKMON archive. The images, charts and maps will all automatically be created from the pickle and data already in our archive.